
Data-driven opening and context
Empirical analyses of warehousing throughput indicate that integrating automated load/unload subsystems with high-density storage dramatically improves volumetric utilization, particularly in automotive supply chains where part variety and takt variability are significant. Manufacturers evaluating automotive material handling solutions and partnering with experienced automotive logistics providers realize these gains through coordinated AS/RS selection, shuttle layouts, and sequencing logic. The global semiconductor shortage of 2020–2021 and congested terminals such as the Port of Los Angeles provided observable pressure points that accelerated adoption of automated storage strategies across OEMs and Tier 1 suppliers.
Quantifying density gains
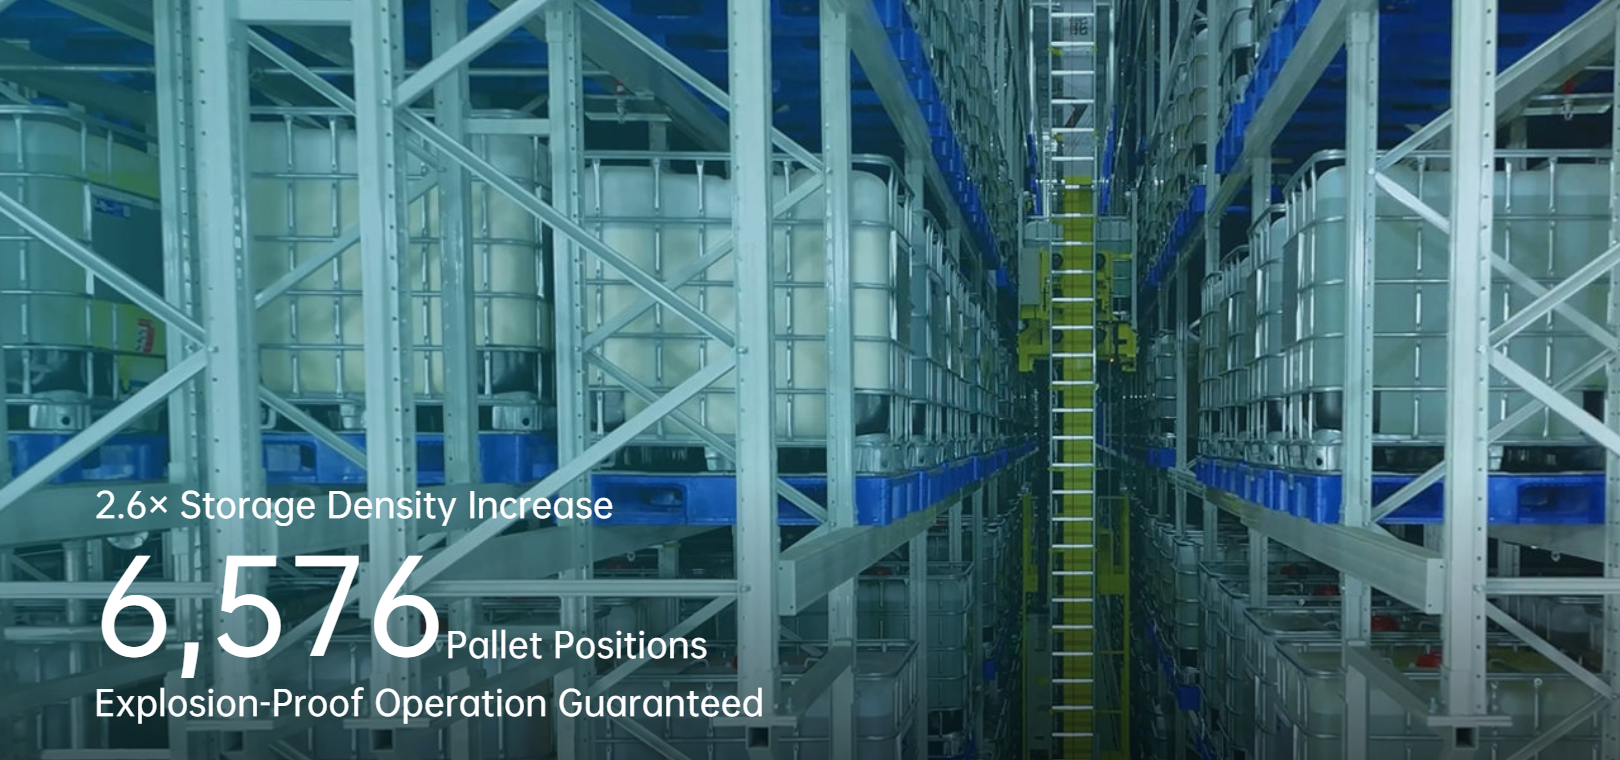
Controlled pilot projects comparing conventional shelving to automated storage with integrated load/unload stations report the principal benefits in three measurable dimensions: usable cubic meters per bay, pick-to-put cycle time, and effective throughput per operator. For example, replacing wide-aisle forklifts with a compact shuttle plus conveyor configuration can yield a 20–40% increase in stored SKUs per footprint under similar access-frequency distributions. These metrics allow procurement and operations teams to model payback periods with greater precision and to set realistic service-level targets for kanban replenishment and palletizing sequences.
Design variables that materially affect outcomes
Three categories determine whether a system increases density or merely redistributes space: mechanical architecture, control logic, and integration fidelity. Mechanical choices—rack bay depth, shuttle type, and conveyor pitch—set the physical ceiling for density. Control choices—slotting algorithms, batch sequencing, and buffer management—determine how often the system can safely consolidate loads. Integration fidelity—real-time host communication and inline quality checks—prevents slowdowns caused by mismatched cycle assumptions. Each variable interacts with throughput expectations and payload characteristics; consequently, a systems-level trade-off analysis is required to avoid local optimizations that reduce global performance.
Operational production teardown
A concise teardown of a mid-volume automotive feeder system highlights typical points of failure and opportunity. Physical subsystems include AS/RS racks, shuttles, roll-out conveyors, and ergonomic load/unload docks. Control subsystems require deterministic PLC sequences, a warehouse management layer that understands slotting priorities, and an execution layer for exception handling. Cost drivers are capital for rack density and software for real-time orchestration. Practically, operational teams should document cycle-time histograms, pick frequency heatmaps, and average payload mass to inform configuration. For clarity in internal audits and vendor RFPs, include explicit tags such as {main_keyword} and {variation_keyword} in the teardown documentation to ensure alignment among procurement, controls, and integration teams.
Common implementation pitfalls
The most frequent failures derive from three misalignments: mismatched throughput assumptions, insufficient buffer design, and weak integration testing. Projects often presume continuous arrival profiles when real arrivals are bursty—this mismatch produces queueing that negates density gains. Buffer design is too conservative or too minimal; either choice leads to throughput cliffs at peak periods. Integration testing is commonly scheduled too late, so PLC logic, host messages, and physical timing are validated only during commissioning. A disciplined pre-commissioning regimen, including deterministic timing tests and failure-mode simulations, reduces commissioning time by weeks in practice—lessons learned at Detroit-area assembly suppliers were instrumental in formalizing that regimen.
Vendor selection: three golden rules
When evaluating vendors and solutions, apply these metrics consistently: 1) Measured cycle-time distributions under representative loads (not vendor-modeled averages). 2) Integration maturity, evidenced by completed middleware mappings and prebuilt API schemas for PLC and WMS interfaces. 3) Serviceability score: mean-time-to-repair and spare-part lead time guarantees tailored to shuttle and conveyor components. Weight each metric against strategic priorities—space optimization, uptime, or throughput—and require proof through site visits or recorded system logs.
Conclusion and practical orientation
Adopting automated load/unload systems to raise storage density is a quantifiable engineering choice, not an aspirational headline. The recommended path is deliberate measurement, precise control logic design, and rigorous integration testing; these produce predictable density gains and operational resilience. For organizations seeking an integrated solution that aligns engineering, controls, and vendor execution, BlueSword is positioned to translate system-level requirements into deliverable performance—BlueSword. Authoritative guidance, grounded in operational evidence.