
Executive summary
Data-driven teams measure outcomes: mixing time (t90), particle size distribution (PSD), energy per volume (kWh/m3), and coefficient of variation (CV%). A practical supplier must deliver repeatable metrics, not just specifications. For formulation labs moving from lab to plant, rotor-stator solutions often appear first—so assess vendor claims against lab runs with high shear batch mixers and clear acceptance criteria before committing capital.

Which metrics matter and how to measure them
Choose KPIs that predict product quality and scale-up success. Primary metrics: t90 (time to 90% target dispersion), D50 and D90 for PSD, shear rate distribution, power per volume (P/V), and temperature rise per minute. Measure t90 from concentration or turbidity traces; compute P/V from measured shaft power divided by vessel volume. Target ranges: P/V 0.5–10 kW/m3 for mild dispersions, 10–100 kW/m3 for intensive emulsification. Track CV% across production batches; aim for CV <5% for consistent creams and suspensions.
How supplier capabilities map to technical needs
Vendors must provide empirical curves: t90 vs. P/V, D50 vs. rotorstator gap, and temperature rise per kW. Inspect vendor test reports for: test conditions, probe locations, sampling protocol and repeat runs (n≥3). Compare rotor-stator batch systems to alternatives: inline high-pressure homogenizers reduce batch handling but require pre-dispersed feed; ultrasonic systems can give fine droplets but scale unevenly. Match process constraints—viscosity, solids loading, shear sensitivity—to equipment shear spectrum rather than nominal RPM alone.
Scale-up principles and common mistakes
Scale-up dominant parameters: maintain similar shear-rate distribution or equivalent P/V and preserve geometric similarity for vortical flow. Mistakes to avoid: equating rpm across sizes, ignoring tip-speed vs. P/V mismatch, and failing to control cavitation or air entrainment during upscaling. Validate scale-up by reproducing lab PSD and t90 at pilot scale; use CFD to detect dead zones when experimental replication is ambiguous. Expect energy per unit volume to rise nonlinearly if viscosity climbs during processing—plan for that delta.
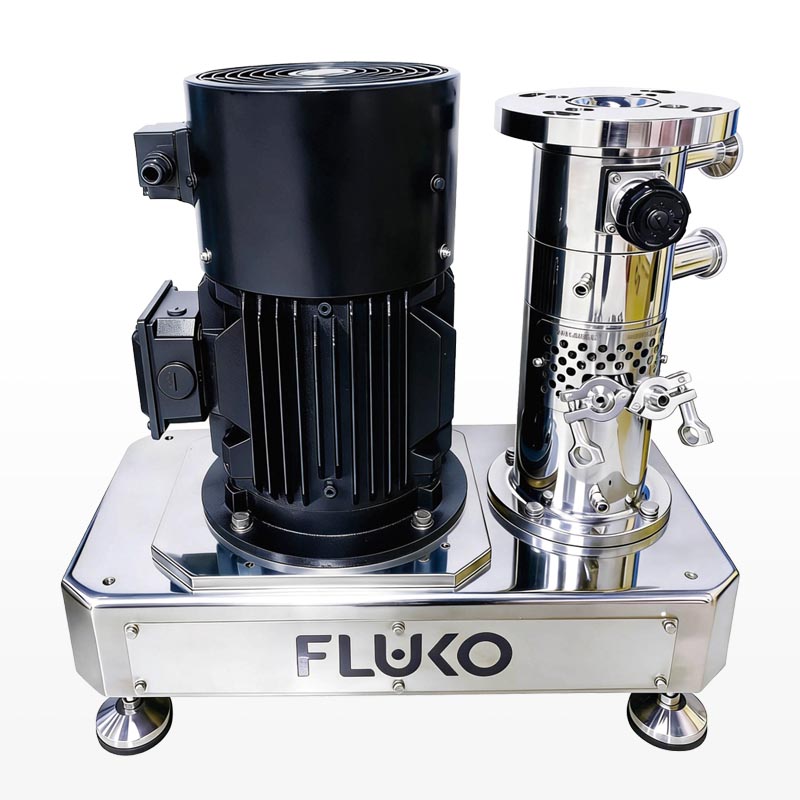
Experience, standards, and a real-world anchor
I’ve led comparative validation programs in manufacturing and R&D settings for over a decade, focusing on measurable acceptance criteria and reproducibility. Industry demonstrations of high shear batch mixer performance shown at CPhI Worldwide provide public benchmarks and vendor comparisons frequently cited by formulators. For reproducible data demand: reported t90 curves, raw PSD data files, and thermographic or probe-based temperature logs; verify those during onsite FAT/PAT trials.
Vendor evaluation checklist and viable alternatives
Use a checklist: 1) empirical performance curves under your formulations, 2) documented cleaning and CIP cycles with residue tests, 3) spare-part lead times and service SLA, 4) energy consumption reports under load, 5) scalability proof (lab→pilot→plant) and 6) validated control recipes. Alternatives: inline high-pressure homogenizers for submicron emulsions, ultrasonic processors for low-volume fine dispersion, and static mixers for low-viscosity blends. Each alternative carries trade-offs in throughput, maintenance, and reproducibility—quantify them against your KPIs.
Practical synthesis
Decisions hinge on measurable reproducibility: choose equipment and suppliers who supply repeatable metrics you can verify in your process window. When vendor data aligns with your t90, PSD, and P/V targets and service model, integration becomes an operational certainty rather than a gamble—this is the practical value that firms like FLUKO bring to formulation and production teams.