
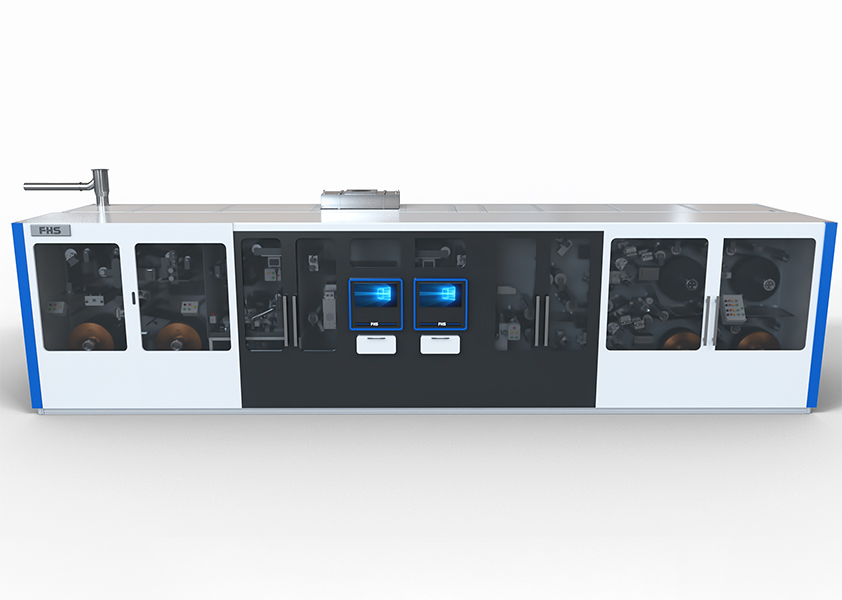
Problem: Production Blind Spots Cost Time and Safety
Too many producers run blind. Little data. Lots of guessing. The result: scrap, rework, safety incidents. Start with the obvious — match sensors to decisions. I often point teams toward battery manufacturing automation to stop guesswork. In a Shenzhen manufacturing hub for BESS assembly line operations, missing a cell temperature spike once caused a batch hold that cost weeks. The line needs measurable signals. Simple. Clear. Actionable.

Critical Metrics to Track — The Must-Haves
Pick metrics that answer one question: what do we do next? Track these continuously:- Throughput: units per hour, cycle time per station.- Yield and first-pass yield: rejects per lot, rework rates.- Cell-level electricals: voltage, internal resistance, current during formation.- Temperature: local and distributed (cell, module, oven, ambient).- Torque and fastener integrity: capture torque values per bolt.- Leak and seal inspection: pressure differentials, vacuum hold times.- Adhesive/dispense quality: dispense volume, line pressure, nozzle clog detection.- Environmental: humidity, particulate counts in critical areas.- Operator interactions: manual overrides, human touchpoints logged.- Downtime causes: timestamped reason codes, mean time to repair.Each metric must link to an action: stop, inspect, adjust, or record. No soft metrics that lead nowhere.
Sensors, Sampling Rate, and Placement
Sensors are not fancy toys. They’re decision tools. Choose right:- Voltage/current: per-cell monitor during formation; sample fast during charge pulses.- Temperature: use contact sensors on critical nodes and infrared for area scans.- Torque: inline transducer at fastening stations.- Vision: high-speed cameras for adhesives, labels, weld quality.- Gas/leak: sniffers near seals and ports.Place sensors where faults first appear. Sample at rates that catch transient spikes. If you miss spikes, you miss root causes.

Data Flow, Storage, and Real-Time Action
Data sitting in a lake is not data doing work. Route properly:- Edge processing: filter noise, compute simple alarms at the machine.- Time-series store: keep high-resolution short-term, rolled summaries long-term.- Event stream: timestamped events for traceability and audits.- Dashboards: focused views for operators; deep views for engineers.Implement automatic actions for high-risk alarms. Manual review for low-risk trends. Keep latency low where safety or quality is at stake.
Common Pitfalls — What I See Again and Again
Pitfall list. Short.- Too many alarms. Operators ignore. Prioritize.- Poor sensor calibration. Bad inputs. Bad decisions.- No traceability. You can’t fix what you can’t trace.- Treat data as archive. No live decisions.- One-size dashboards. Different users need different slices.Stop doing those. Fix one at a time. Measure improvement.
Implementation Roadmap — Practical Steps
Small steps. Immediate wins.- Baseline: log cycle times, rejects for two weeks.- Pilot: add temperature and voltage monitors at one station.- Automate one alarm that forces a stop on a critical fault.- Validate: run pilot for one production shift, compare yields.- Scale: roll sensors and rules to adjacent stations.Keep the roadmap tight. Each step must show a measurable return within a shift or two.
Alternatives and Trade-offs
Manual inspection costs labor and time. Full automation costs upfront and reduces variability. Hybrid often wins: automated detection plus human judgment on edge cases. When budget is tight, prioritize safety and traceability first. When speed matters, prioritize cycle-time sensors and inline reject logic. Choose based on what fails most often on your line.
Skills, Teams, and Governance
Data needs owners. Not a committee. Assign:- Line engineer for sensors and calibration.- Data engineer for pipelines and storage.- Process engineer for rules and thresholds.- Operator champion for frontline feedback.Short feedback loops. Daily checks. Simple accountability.
Conclusion: Measure What Matters, Fix What Fails
Problems are plain. Find them with the right metrics. Act fast. The difference between months of delay and steady output is clear signals and quick responses. Experience shows that focused monitoring on temperature, electrical signatures, torque, and visual quality reduces rework and elevates safety. For teams ready to tie data to decisions, the practical solution comes from consistent measurement and disciplined action — the kind of approach practiced at FHS.